Pressure dependence of the optical properties of the charge-density-wave compound RTen (n=2 and 3)

By performing pressure dependent optical investigations on a novel class of low dimensional materials (rare earth tri-tellurides), we demonstrate that one can tune (in this case gradually suppress) the charge density wave (CDW) gap by reducing the lattice parameter. Such control of the CDW gap is similar to that caused by chemical means (i.e. by alloying through rare-earth substitution). Therefore, we establish the equivalence of chemical and applied pressure in governing the onset of the CDW broken symmetry ground state (Fig. 3.8). This is especially interesting because the present results emphasize that the suppression of the CDW gap is not a result of disorder (which necessarily comes into play as a consequence of chemical substitution), but clearly arises from internal changes of the effective dimensionality of the electronic structure. This strengthens the arguments regarding the link between CDWs and nesting of the Fermi surface in low dimensional materials. We propose that the broadening of the bands upon lattice compression in the layered rare earth tri-tellurides removes the perfect nesting condition of the Fermi surface and therefore diminishes the impact of the CDW transition on their electronic properties.

We have also investigated the pressure dependence of the optical response of LaTe2, which is deep in the charge-density-wave (CDW) ground state even at 300 K. The reflectivity spectrum (Fig. 3.9) is collected in the mid-infrared spectral range at room temperature and at pressures between 0 and 7 GPa. Applying a well established procedure based on the phenomenological Lorentz-Drude (LD) approach, we extract the energy scale due to the single particle excitation across the CDW gap and the Drude weight (Fig. 3.10). We establish that the gap decreases upon compressing the lattice, which shares common features with the behavior seen previously in the RTe3 series and in our recent data on CeTe3 under pressure. This signals a reduction in the quality of nesting upon applying pressure, therefore inducing a lesser impact of the CDW condensate on the electronic properties of LaTe2. The consequent suppression of the CDW gap leads to a release of additional charge carriers, manifested by the shift of weight from the gap feature into the metallic component of the optical response and indicated by the enhancement of the plasma frequency ωp (inset of Fig. 3.10). On the contrary, the power-law behavior, seen in the optical conductivity at energies above the gap excitation and suggesting a weakly interacting limit within the Tomonaga-Luttinger liquid scenario, seems to be only moderately dependent on pressure.

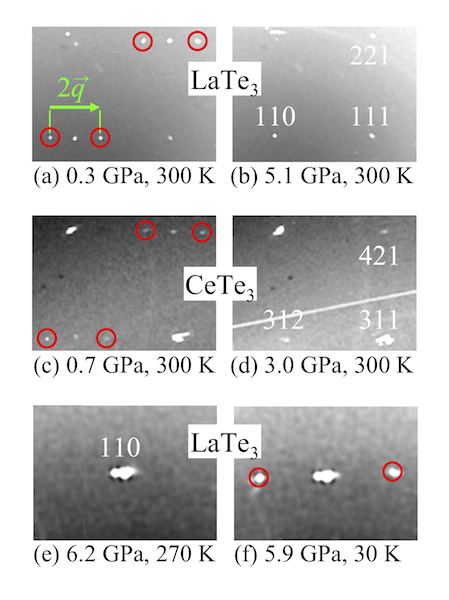
In order to support the suppression of the CDW state upon compressing the lattice, we have also reported an x-ray diffraction study on the charge-density-wave (CDW) LaTe3 and CeTe3 compounds as a function of pressure (Fig. 3.10.1). We extract the lattice constants and the CDW modulation wave-vector. We observe that the intensity of the CDW satellite peaks tend to zero with increasing pressure (Fig. 3.10.2), thus providing direct evidence for a pressure-induced quenching of the CDW phase. Our findings further support the equivalence between chemical and applied pressure in RTe3, put forward by our previous optical investigations.

Related papers
- external pageChemical pressure and hidden one-dimensional behavior in rare-earth tri-telluride charge-density wave compounds
- external pagePressure dependence of the charge-density-wave gap in rare-earth tritellurides
- external pageOptical properties of the Ce and La ditelluride charge density wave compounds
- external pagePressure dependence of the single particle excitation in the charge-density-wave CeTe3 system
- external pagePressure-induced quenching of the charge-density-wave state in rare-earth tritellurides observed by x-ray diffraction