Raman scattering investigations on the rare-earth tri-tellurides

We have reported on a Raman scattering investigation of the charge-density-wave (CDW), quasi two-dimensional rare-earth tri-tellurides RTe3 (R = La, Ce, Pr, Nd, Sm, Gd and Dy) at ambient pressure, and of LaTe3 and CeTe3 under externally applied pressure. Figure 3.11(a) summarizes the Raman scattering spectra, collected for the whole RTe3 series (i.e. chemical pressure). Four distinct modes at 72, 88, 98 and 109 cm-1 and a weak bump at 136 cm-1 (labelled P1-P5, respectively) can be identified in the La compound. The P1 mode slightly softens from La to Nd and slowly moves outside the measurable spectral range at ambient pressure (i.e. in SmTe3 only its high frequency tail is still observable). The remaining modes weakly disperse and progressively disappear when going from the La to the Dy compound along the rare-earth series. Panels (b) and (c) in Fig. 3.11 display the Raman scattering spectra of LaTe3 and CeTe3, under increasing and decreasing externally applied pressure.
As in the chemical pressure case, all other modes slightly disperse and disappear upon applying pressure. This qualitative equivalence between chemical and applied pressure is also supported by the fact that the peaks in LaTe3 disappear at a slightly higher pressure than in CeTe3. The pressure dependence is fully reversible since upon decreasing pressure the modes reappear again. The observed phonon peaks can be ascribed to the Raman active modes for both the undistorted as well as the distorted lattice in the CDW state by means of a first principles calculation.

An important result of our experimental investigation is the observation of a systematic decrease of the integrated intensity (I) of the most prominent peaks P2 and P4 in the Raman spectra of Fig. 3.11 with pressure, which bears a striking similarity with the behaviour of the amplitude of the CDW-gap Δ (i.e. the order parameter) upon compressing the lattice, as obtained from the optical conductivity. Figure 3.12 shows that the intensities of the P2 and P4 peaks scale fairly well with Δ4 and Δ2, respectively, suggestive of a coupling between the lattice vibrational modes and the CDW condensate. This is not at all surprising, as our calculations predict these peaks only in the distorted structure. Furthermore, the specific behaviour (I ∼ Δq , q = 2 or 4) is consistent with theoretical predictions for the intensity in the distorted phase of originally silent modes, obtained from a group theoretical analysis in the framework of Landau's theory of second order phase transitions.

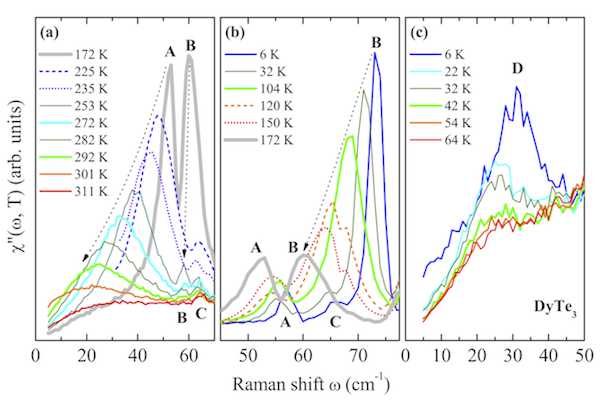
We also presented Raman scattering investigations as a function of temperature on DyTe3 at ambient pressure (TCDW1 = 307 K, TCDW2 = 49 K) and on LaTe3 at 6 GPa, with a lattice constant between that of DyTe3 and HoTe3, and TCDW1 ∼ 260 K. The covered spectral range extends from 5 to 200 cm-1, i.e. well beyond the previous low frequency limit of about 65 cm-1 (see above), thus giving access to the energy region in which the collective modes are expected to appear. In the temperature interval between TCDW1 and 50 K, we observe that, in both systems, the amplitude mode in the unidirectional CDW phase exhibits a transition to a higher frequency around TTr ∼ 170 K, which manifests itself in the form of a transfer of spectral weight between two peaks (A and B in Fig. 3.13), whose positions as a function of temperature are well described by a BCS model for two condensate densities with different critical temperatures. These consecutive unidirectional CDW transitions can be clearly resolved in our experiment and represent a genuine experimental breakthrough, highlighting the importance of bilayer effects. Furthermore, a new feature below 50 K appears in DyTe3 (D in Fig. 3.13). From its temperature dependence, it can be unambiguously identified with the amplitude mode associated with the bidirectional CDW phase.
